Seattle-Bellevue Market Update: April 2019
The Seattle-Bellevue residential real estate market continues to move strongly ahead along the trends previously reported this year.
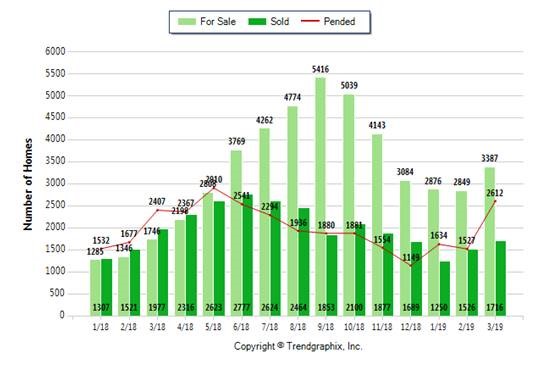
The following graph for King County outlines single-family home sales (Solds) versus properties on the market (For Sale/Inventory), while also indicating the quantity of properties that have gone under contract (Pended).
There was a 10.3% increase in inventory (homes for sale) from March 1-21 to April 1-21, at 3,245 homes and 3,578 homes, respectively. There was also a higher percentage increase in sales—at 28.4%—and properties going under contract, at 18.4%. As previously reported, the number of homes going under contract continues to increase more than the number of homes coming onto the market, indicating that demand is gradually increasing more than supply.
It is interesting to note there was a 94% increase in the supply of homes on the market from the first quarter of 2018 (1,746 homes) relative to the first quarter of 2019 (3,387), which is the aftermath of the May 2018 price correction that caused home values to decrease and eventually level off in December 2018 to January 2019. See tthe article I posted in September 2018 on What to Make of Seattle’s Market Cooldown.
THE RIPPLE AFFECTS FROM THE 2018 PRICE CORRECTION
Valuing a property based only on square footage (i.e. dollar per square foot) is not an accurate method for single-family properties—there are many factors to consider in concert together. For example, if you were only going to rely on square footage as a value metric, that would only apply to condos in the same building, with similar views, within a few floors of each other with similar updates.
The Assessed Value specified by the county is not the Market Value (i.e. what a ready, willing and able buyer will pay), which is typically higher than the assessed value for the majority of properties. Recently, however, there have been many instances of homes selling for less than the Assessed Value due to the May 2018 price correction (i.e. price decrease and supply increase). The phenomenon of homes selling below assessed value is more common in suburban and rural areas with lower demand—such as Sammamish—relative to the higher demand urban areas of Seattle and Bellevue. However, some condos in downtown Seattle have sold for less than the Assessed Value. Now, home values are generally what they were a year ago.
Moreover, the May 2018 price correction also significantly distorted many online home value estimates (e.g. Zestimates). This is evident from the significant gaps in estimated values that vary from website to website.
THE CURRENT MARKET AND FORECAST
Based on the past seasonal trends, current market conditions and economic developments, it appears the quantity of homes for sale (supply) and sold properties (demand) could reach equilibrium around November 2019, which could lead to higher appreciation rates, thereafter, in the future as supply tightens.
Interest Rates
Mortgage applications to purchase a home rose 1% last week from the previous week and were 7% higher than a year ago. This month, purchase applications reached their highest level since April 2010 (in 9 years).
In 2018, the Federal Reserve had increased the federal funds rate several times, which translated to higher borrowing costs (i.e. higher mortgage interest rates) to cool a vibrant and growing U.S. economy, which was a contributing factor to our local Seattle-Bellevue price correction that began in May 2018 and leveled-off in December 2018 to January 2019. Beginning in December 2018 to March 2019, it became increasingly clear the Federal Reserve had reconsidered its rate hike plan and was on pause. Now, the Federal Reserve seems to be considering reducing the federal funds rate, which could lead to increased demand from home buyers, if mortgage interest rates decrease.
local economy
I do not believe home price growth in the Puget Sound region will decrease in the long term, especially as you consider job growth—which is estimated at 60,000 new jobs annually over the next 3.5 years—and critical infrastructure developments underway. See my article posted December 19, 2018 on How to Time the Market.
Millennials are forecast to become the largest U.S. population group by overtaking Baby Boomers, and Seattle is on their top 10 list of places to live. More than three-quarters of millennials want to become home owners and are increasing demand for home buyers.
"Many people (millennials) are basically skipping starter homes; they're renting until their 30s, and that first house they buy is a million dollars, and they just are not even buying the $200,000, $300,000, $400,000 home, which is a total mind shift as compared with previous generations. So they're still buying homes — they're just buying them later and buying them bigger."
U.S. Economy
Employers added 196,000 jobs to the U.S. economy in March, which was more than expected. The unemployment rate held steady at 3.8%, just above a 49-year low, while average hourly wages for private-sector workers climbed 3.2% from a year earlier.
U.S. economy grows 3.2% in the first quarter, well above estimates as of April 26, 2019
Global Economy
There will be a tremendous boost to the global economy in 2019 if a trade deal between the two largest economies on earth (China and the U.S.) is achieved. Manufacturing is expanding in both countries and a deal one way or another seems imminent and is expected in late May or early June.
Bottom line, it’s a good time to buy and sell real estate. The sky is not falling…in fact, I believe the sun is just starting to rise.🏘☀️
Please contact me if you’d like representation and guidance to reach your real estate goals.


